Watch our giving day promotional for 2023!
Every year the University of Oklahoma hosts Giving Day, a 24 hour long donation challenge where donors, alumni, and organization members compete for awards that match their donations.
My friends and I in robotics stayed up until midnight, timing donations and trying to knab extra funding. There was some fierce competition from the rest of the engineering college, but this year we raised our most ever from giving day at $6500!
The day after, all of us were crawling over a giant database with all the donation data. Plotting it, analyzing it, finding out who the biggest donors were (and reading some of the funnier submitted names). I got the urge to put it all into one of those racing bar charts videos that are all over youtube.
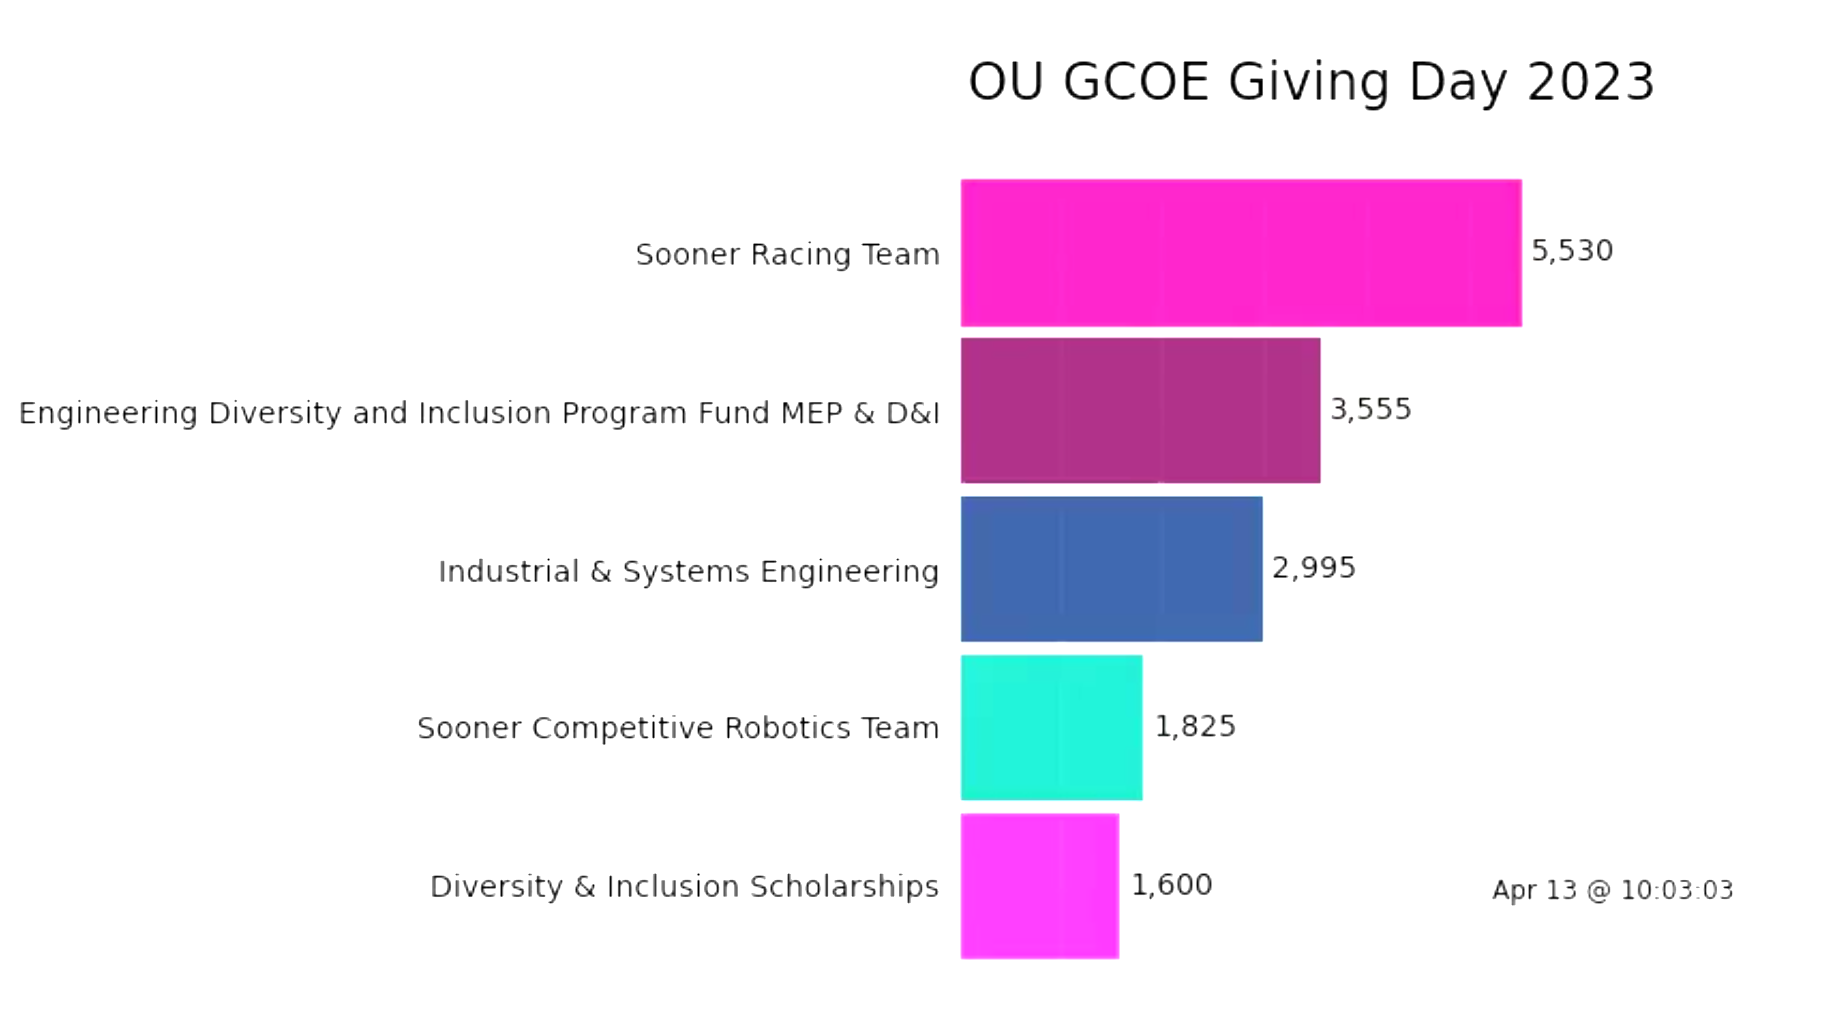
Racing bar charts
These videos were created using the bar-chart-race library in python. This library works on any time series set of data. I used a pivot table in excel to organize the donations by time stamp, and removed non-GCOE campaigns. The original dataset used a universal date and time format, which I converted to central time (our timezone at OU) using regular expressions in python.
OU College of Engineering Top 5
I made two different versions of the race. One that focused on the top 5 and the other that focused on the top 10. I think the top 5 looks a little better, but the top 10 is nice for seeing where more of the funds ended up. There's not much activity before 8 am April 13th (sans Sooner Racing Team), but after that it gets interesting.
OU College of Engineering Top 10


